Title here
Summary here
Colander allows you to retrieve information from 3rd-party services such as VirusTotal, MISP and OTX Alien Vault. To do so, Colander relies on Threatr which operates as a bridge and translator between Colander and the external services.
The main purpose of Threatr is to transform the entities available on external services to knowledge graph following the same codification as Colander. The workspace Investigate is the main entry point in Colander to request information to external services.
Even if it is designed to operate along with Colander, Threatr can be used standalone and users can interact with it via its REST API.
By now, Threatr supports requests on the following types of observables:
IPV4IPV6DOMAINMD5SHA1SHA256EMAILAnd can return various types of information such as threats, VirusTotal detection score or reports.
Threatr propagates user’s requests to the different configured 3rd-parties and returns the aggregated entities along with the knowledge graph linking the different found entities with the requested one. Threatr stores the results in its internal database and will always return the data already stored unless the checkbox Update results from vendors. is checked. By forcing the refresh of the data, Threatr will propagate the user’s request to all the different 3rd-party configured.
Check Threatr documentation to learn more about available integrations.
The user interface of the Investigate workspace is composed of 5 different sections:
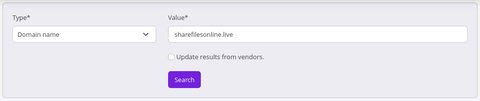
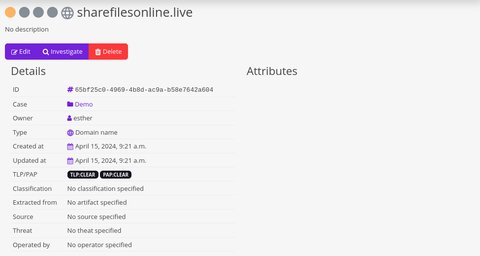
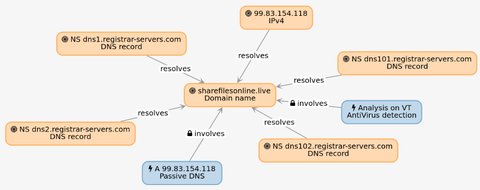
To search for an observable, select its type and specify its value. In the example below, we want to retrieve information about the domain name sharefilesonline.live.
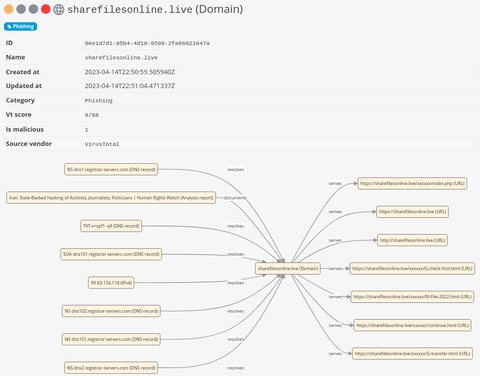
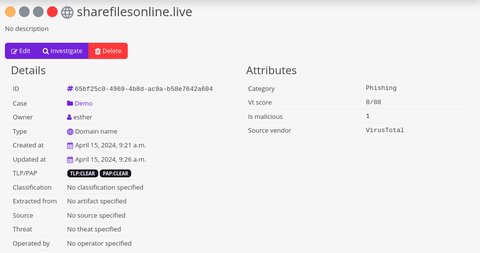
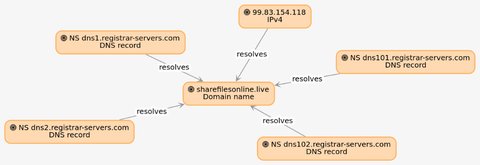
Once the results are available, Colander shows details retrieved about the requested observable and a summary of the results in the form of a knowledge graph.
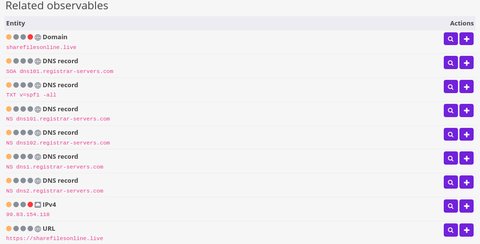
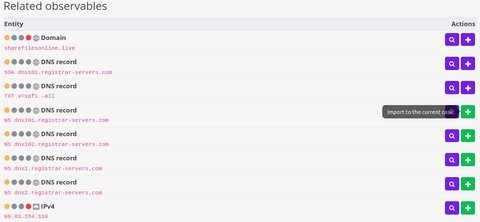
The next section contains the list of all the observables that are related to the requested one. From this list, you can either pivot on a specific observable or add it to your current case.
The next section contains the list of the events involving the requested observables. Those events can be detections, passive DNS resolutions, etc. From this list, you can import events directly into your current case.

Alternatively to the search form, you can jump into the Investigate workspace directly from an existing observable by clicking on the button Investigate accessible in the details of the observable.
Then, in the list of observable, the first one will always corresponds to the requested one. If you add it to your case, Colander will automatically merge the information already specified with the ones coming from the external services.
When we import observables from the Investigate workspace to your current case, Colander will automatically merge the knowledge graph representing the results from the external services with your existing knowledge graph. As an example, let’s imagine that your current case only contains one observable sharefilesonline.live, your knowledge graph contains only one node.
From the Investigate workspace, you add some observables, your knowledge graph now contains all the imported observables.
Your knowledge graph now contains all the imported observables.
From the Investigate workspace, you can also import events.

Your knowledge graph now contains the events you just imported.
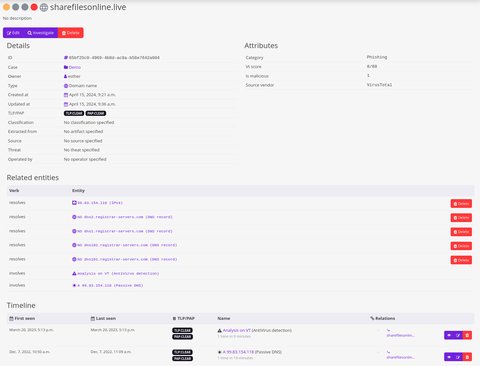
Now, in the details of the sharefilesonline.live observable, you will find the list of the related entities and the timeline containing the information you imported.