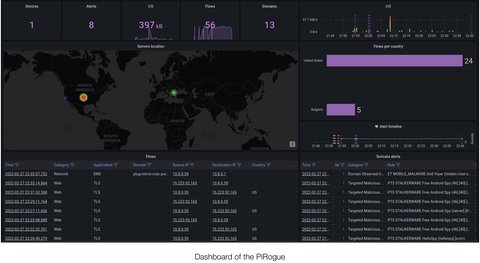
General statistics panel provides a comprehensive overview of network activity and security events within the selected timeframe. It presents a detailed breakdown of the following metrics:
Connected devices: The panel displays the total number of unique devices that have connected to the PiRogue’s Wi-Fi network during the selected period.
Security alerts: The panel highlights the number of security alerts triggered by Suricata rules during the selected period. These alerts indicate potential intrusion attempts, malicious activities, or policy violations.
Network I/O: The panel showcases the total amount of network traffic exchanged between connected devices and the Internet during the selected period. This metric reflects the overall network bandwidth consumption and data transfer activity.
Network flows: The panel exhibits the total number of network flows that have occurred during the selected period. Network flows represent individual communication sessions between devices, providing insights into network usage patterns and application behavior.
World map panel displays the location of the different servers the connected devices have been communicating with during the selected period of time.
Network flows panel provides a comprehensive overview of network flows that have occurred during the specified timeframe. It presents detailed information about each flow, including:
The exact time at which the flow commenced
The traffic category as determined by NFStream’s classification engine
The type of application responsible for generating the flow
The domain name of the server that was contacted during the flow
The IP address of the flow’s source, indicating the originating device
The IP address of the flow’s destination, indicating the target server
The country where the remote server is geographically located
The total amount of network traffic associated with the flow, indicating its data volume
This detailed information allows for in-depth analysis of network activity, enabling security professionals to identify patterns, anomalies, and potential security risks.
Suricata alerts panel provides a comprehensive overview of security alerts generated by Suricata during a specified timeframe. Each alert is presented with detailed information, including:
The timestamp of the alert. Clicking on the timestamp will provide in-depth details about the selected alert.
The severity level of the alert, indicating the potential impact and urgency of the detected threat.
The type of threat associated with the alert, classifying the nature of the malicious activity or intrusion attempt.
The name of the rule that triggered the alert, providing insight into the specific pattern or behavior that raised suspicion.
The IP address of the source of the network traffic associated with the alert, identifying the origin of the potential threat or indicating the intended target of the suspicious activity
The IP address of the destination of the network traffic associated with the alert, identifying the origin of the potential threat or indicating the intended target of the suspicious activity.
This comprehensive presentation of security alerts enables security analysts to quickly assess the severity and nature of potential threats, allowing for prompt investigation and response to safeguard the analyzed device and its assets.
⚠️ Note that the PiRogue keeps 5 days of history, data older than 5 days is automatically deleted.