Title here
Summary here
PiRogue tool suite (PTS) is an open-source tool suite that provides a comprehensive mobile forensics and network traffic analysis platform targeting mobile devices both Android and iOS, internet of things devices, and in general any devices using WiFi to connect to the Internet.
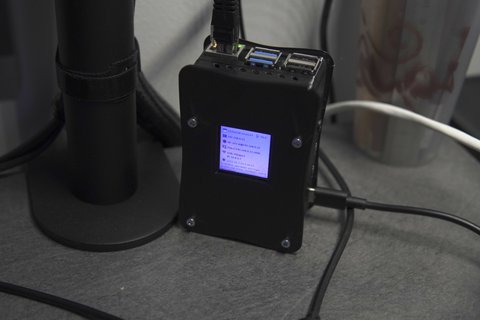
Raspberry Pi-based PiRogue
This guide explains how to install PiRogue on a Raspberry Pi. To learn how to install PiRogue in other configurations, refer to the installation documentation.
The PiRogue is an open hardware device based on a Raspberry Pi operating as a network router (like any ISP router) analyzing network traffic in real time.
It can operate in different modes:
an on-the-field mode
an expert mode for technical people to:
In addition to a computer and an Internet connection, you will need, at least, a Raspberry Pi (+ its power supply), a micro SD-card and an ethernet cable.
First, you need a Raspberry Pi. We support the following versions of Raspberry Pi:
If you want to buy a Raspberry Pi, visit the rpilocator website to check for availability.
Power supply
Be sure to have an appropriate power supply for your PiRogue. If you don’t know what to choose, pick the official Raspberry Pi power supply.
Limitations
Raspberry Pi devices have slower, more power-efficient processors, limited memory, and limited onboard WiFi throughput compared to conventional computers. These limitations can potentially affect their performance when running demanding tasks. Due to the limited performance of Raspberry Pi devices, we recommend using PiRogue with up to 2-3 devices connected to the Wi-Fi access point simultaneously.
Suricata, the Intrusion Detection System (IDS) and network security monitoring engine, requires significant system resources. It needs enough memory to hold rules and process large volumes of network packets. To conserve resources on devices with limited RAM, Suricata is automatically disabled on systems with less than 2.5GB of RAM. This limitation is set in the file /etc/systemd/system/suricata.service.d/override.conf.
Secondly, you need a SD-card to run your PiRogue. The SD-card has to be large enough to store the operating system and all the data generated by the PiRogue itself. By default, it stores 5 days of network traffic history.
You may choose:
For a faster booting experience and improved disk write performance, invest in a high-quality micro SD-card from a reputable brand. Look for one with Application Performance Class 1 (A1) and Speed Class 10.
In order to connect the PiRogue to the Internet, you should have an ethernet cable connecting your PiRogue to your network. A simple cat. 5 ethernet cable will do the job.
Depending on your needs, you would want to add a hat to your PiRogue and protect everything with a case. Check the documentation for more details.
Need help?
If you don’t feel comfortable with building the case or the hat, feel free to buy one by reaching out to us.
PiRogue OS is periodically released. The OS is pre-configured so you just need to flash it on a micro SD-card. The image (the binary file to be flashed on the SD-card) is compressed. The file you have to download on your computer has a name following this schema
PiRogue-OS-<Debian major version>-<supported hardware>-<year>-<month>-<day>.img.xz.
Download the latest version of PiRogue OS →
Once you have downloaded the image, you can check its integrity (check if the file has not been modified or corrupted) by comparing its SHA256 and the SHA256 displayed on the GitHub page. If both SHA256 are the same, the file you downloaded has not been tampered.
To compute the SHA256 of the file you downloaded, run the following command in a terminal:
Replace [image file name].img.xz with the image file you just downloaded.
Advanced Linux users can use a combination of xz and dd commands to flash their SD-card.
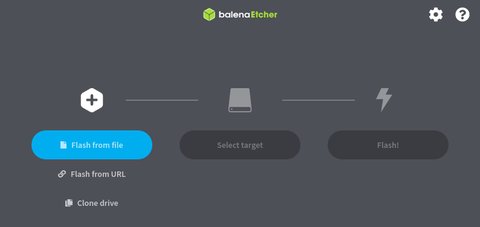
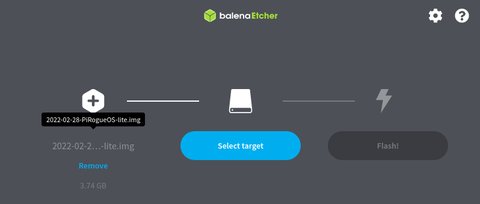
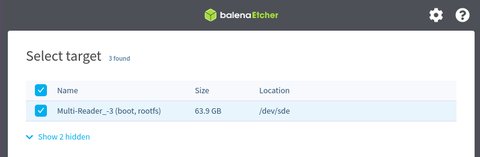
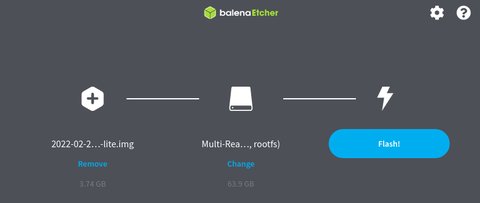
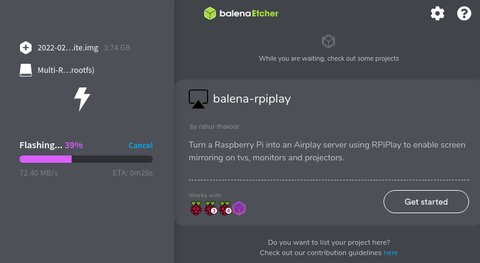
We recommend downloading and installing Balena Etcher on your computer. Run Balena Etcher as administrator. This software allows you to flash compressed images; however, if you encounter any difficulties, uncompress the image file before flashing.
Please follow the steps outlined in the screenshots below for successful completion.

Once the flashing is complete, eject the SD-card from your computer.
If you have the hat for your PiRogue, it is the good time for you to plug it in and put everything into the case. Insert your freshly flashed micro SD-card into the PiRogue, plug the ethernet cable to the PiRogue. Remember, this cable connects your PiRogue directly (or through network switch) to your ISP router.
Caution
To operate properly, your PiRogue needs to have Internet access.
First, check that the SD card is correctly inserted into the appropriate slot of your PiRogue and the ethernet cable is properly connected. Then, plug the power supply. Wait a few minutes before trying to access your PiRogue.
Now, connect to your PiRogue using SSH.
ssh pi@pirogue.localType raspberry which is the default password of the user pi and press Enter.
Once connected, you have to finalize the installation of your PiRogue.
Firsly, you’ll be asked to change the Unix password, the new password you’ve set replaces the default one. Once you have change the Unix, you must reconnect to your PiRogue with SSH.
Secondly, you have to install PiRogue packages and features. To do so, you need to run the following commands on your PiRogue. Copy and execute each command separately one by one:
| Command Line | Description |
|---|---|
sudo apt update | Gets the latest versions of the available packages |
sudo apt dist-upgrade -y | Upgrade the entire operating system and all additional installed software |
sudo apt install pirogue-base -y | Install the PiRogue packages and features |
sudo reboot | Reboot the PiRogue |
During the installation, if asked, you will have to answer:
No to save firewall rules for IP v4No to save firewall rules for IP v6Yes to allow non-root users to capture network traffic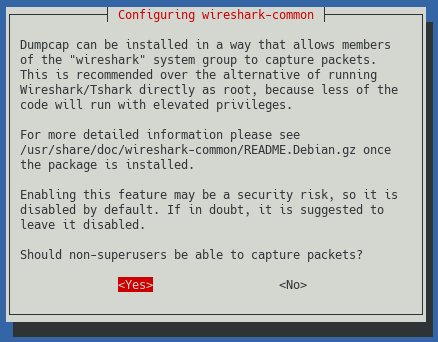
Caution
If you’re setting up the PiRogue in the context of an organization at your office or your lab you will have to enforce your internal security policies and guidelines. At least, change your password using the passwd command.
After the reboot, wait a few minutes, you will then be able to connect a Wi-Fi device and use the PiRogue’s dashboard.
Important note about telemetry
The telemetry is enabled by default but you can easily opt out. Find more details in the section dedicated to the telemetry.
Before connecting a device to the WiFi access point of the PiRogue or opening the dashboard, you have to determine what version of PiRogue you are using. To do so,
run the following command on your PiRogue. The version of your PiRogue corresponds to the version of the package pirogue-base.
$ dpkg -l | grep pirogue-base
ii pirogue-base 2.0.2 all Install all PiRogue packagesIt will take around 4 minutes before network flows start appearing in the dashboard. At the first start of your PiRogue the dashboard will look empty or broken. Don’t worry, connect a device to the PiRogue’s WiFi network, wait 5 minutes and refresh the dashboard by pressing F5 key on your keyboard.
Once your PiRogue is running, it will be accessible to you from the network. There are 2 ways to get the IP address of your PiRogue.
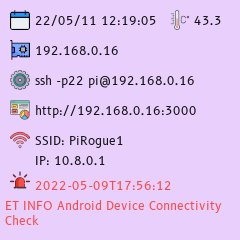
The first way is by looking at the screen of the PiRogue Hat.
The second way is to use the ping command. To do so, on your computer connected to the same network as your PiRogue, run the following command:
ping -c1 pirogue.localThe PiRogue is designed to continuously analyze the network traffic of any device connected to its Wi-Fi network. This means that it is constantly monitoring and inspecting the data packets that are being transmitted and received by these devices. The purpose of this analysis is to identify any suspicious or malicious activity that may be taking place on the network.
The PiRogue employs two primary methods for analyzing network traffic: Deep Packet Inspection (DPI) and Suricata rule-based detection.
DPI is a technique that allows the PiRogue to examine the contents of data packets in detail. This includes information such as the source and destination IP addresses, the ports being used, the type of data being transmitted, and even the identification of the application involved. By analyzing this information, we can identify patterns and anomalies that may indicate malicious activity.
Suricata is an open-source intrusion detection system (IDS) that uses a set of rules to identify known threats. These rules are constantly being updated to keep up with the latest threats. The PiRogue comes pre-configured with rules from ProofPoint Emerging Threat Open and Echap, two reputable sources of threat intelligence.
Important note
Suricata is disabled on devices having less than 2.5GB of RAM.
The results of the PiRogue’s automatic analysis can be visualized in the dashboard. This dashboard provides a graphical overview of the network traffic that has been analyzed, as well as any threats that have been detected. The dashboard also allows users to drill down into the details of specific network flows to learn more about them.
Data retention
The PiRogue keeps 5 days of history, data older than 5 days is automatically deleted.
The default dashboard is composed of different panels, we will go through the main ones.
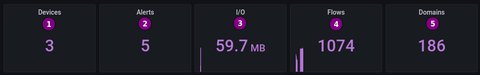
This panel displays various information:

This panel displays the location of the different servers the connected devices have been communicating with during the selected period of time.
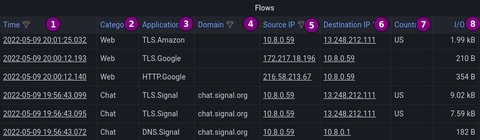
This panel displays the different network flows that have occurred during the selected period of time:
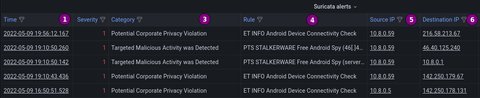
This panel displays the different security alerts generated by Suricata that have occurred during the selected period of time: